Warner, A., LeDue, J., Cao, Y., Tham, J., & Murphy, T. H. (2025). Synthetic patient and interview transcript creator: an essential tool for LLMs in mental health. Frontiers in Digital Health, 7. doi:10.3389/fdgth.2025.1625444
 Developing high-quality training data is essential for tailoring large language models (LLMs) to specialized applications like mental health. To address privacy and legal constraints associated with real patient data, we designed a synthetic patient and interview generation framework that can be tailored to regional patient demographics. This system employs two locally run instances of Llama 3.3:70B: one as the interviewer and the other as the patient. These models produce contextually rich interview transcripts, structured by a customizable question bank, with lexical diversity similar to normal human conversation. Demographic distributions of generated patient profiles were not significantly different from real-world population data and exhibited expected variability. Additionally, for the patient profiles we assessed LLM metrics and found an average Distinct-1 score of 0.8 (max = 1) indicating diverse word usage. By integrating detailed patient generation with dynamic interviewing, the framework produces synthetic datasets that may aid the adoption and deployment of LLMs in mental health settings.
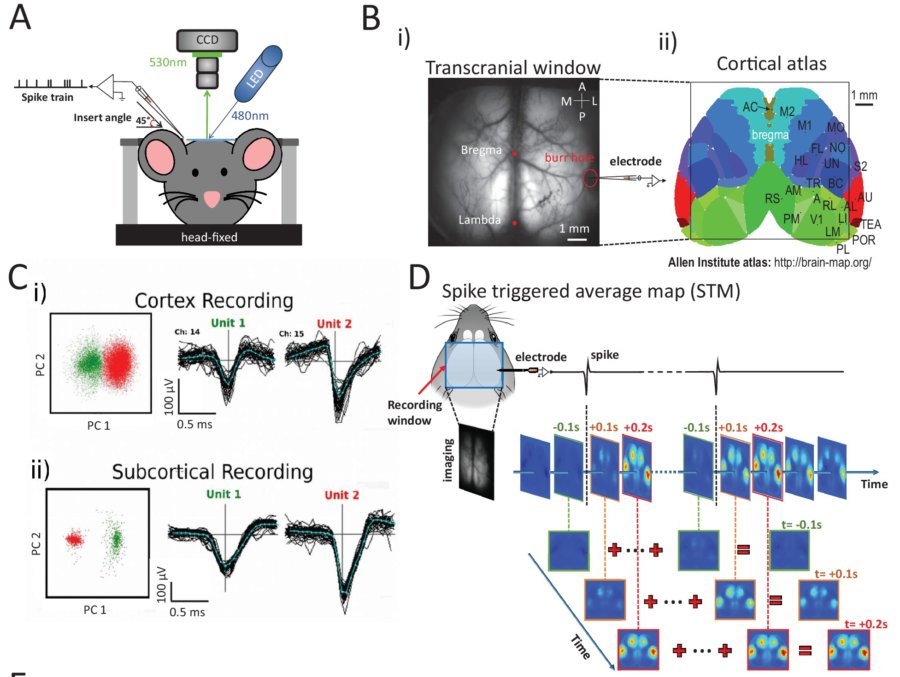
Links between cortical mesoscale activity patterns and peripheral nerve activity revealed by Mesotrode
Dongsheng Xiao, Yuhao Yan, Timothy H Murphy 2023 Mesotrode: chronic simultaneous mesoscale cortical imaging and subcortical or peripheral nerve spiking activity recording in mice. bioaRxiv 2023.02.01.526489; doi: https://doi.org/10.1101/2023.02.01.526489 published Elife via bioaRXiv
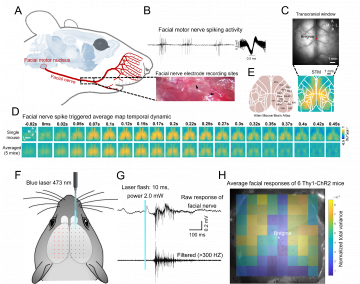
We harnessed the flexibility of chronic multi-site tetrode recordings to monitor single-neuron activity in multiple subcortical structures (or peripheral sites) while simultaneously imaging the mesoscale activity of the entire dorsal cortex. Facial nerve spiking is functionally associated with the PTA, RSP, and M2 network, and optogenetic inhibition of the PTA area significantly reduced the facial movement of the mice.
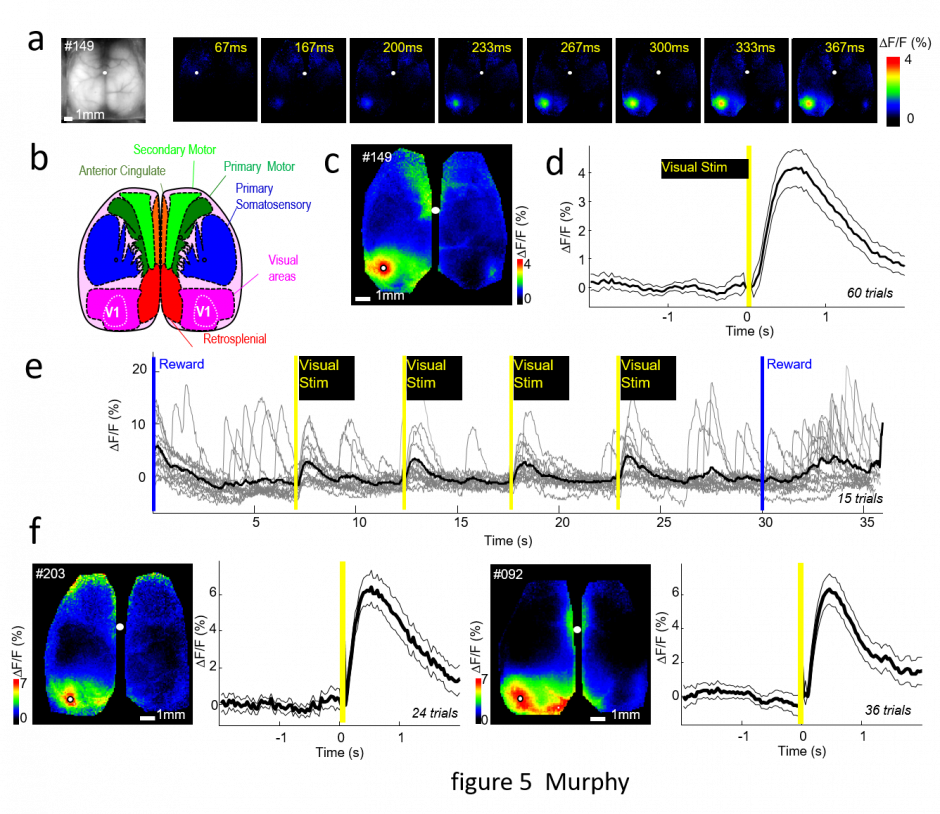
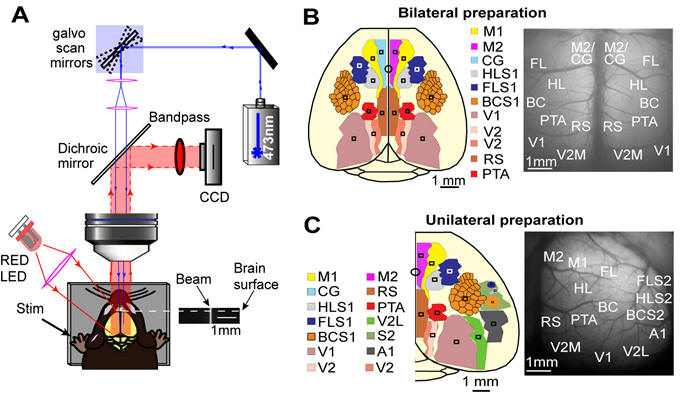
Chronic multiscale resolution of mouse brain networks using combined mesoscale cortical imaging and subcortical fiber photometry
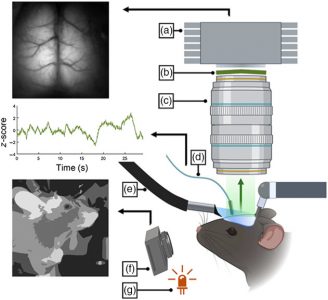
We have developed an optical and surgical preparation that preserves wide-field imaging of the cortical surface while also permitting access to specific subcortical networks. This was achieved using an optical fiber implanted in the striatum, along with a bilateral widefield cranial window, enabling simultaneous mesoscale cortical imaging and subcortical fiber photometry recording of calcium signals in a transgenic animal expressing GCaMP. Subcortical signals were collected from the dorsal regions of the striatum. We combined this approach with multiple sensory-motor tasks, including specific auditory and visual stimulation, and video monitoring of animal movements and pupillometry during head-fixed behaviors. We found high correlations between cortical and striatal activity in response to sensory stimulation or movement. Furthermore, spontaneous activity recordings revealed that specific motifs of cortical activity are correlated with presynaptic activity recorded in the striatum, enabling us to select for corticostriatal activity motifs.
Neurophotonics doi: 10.1117/1.NPh.10.1.015001. Epub 2023 Jan 21.
Towards a Visualizable, De-identified Synthetic Biomarker of Human Movement Disorders
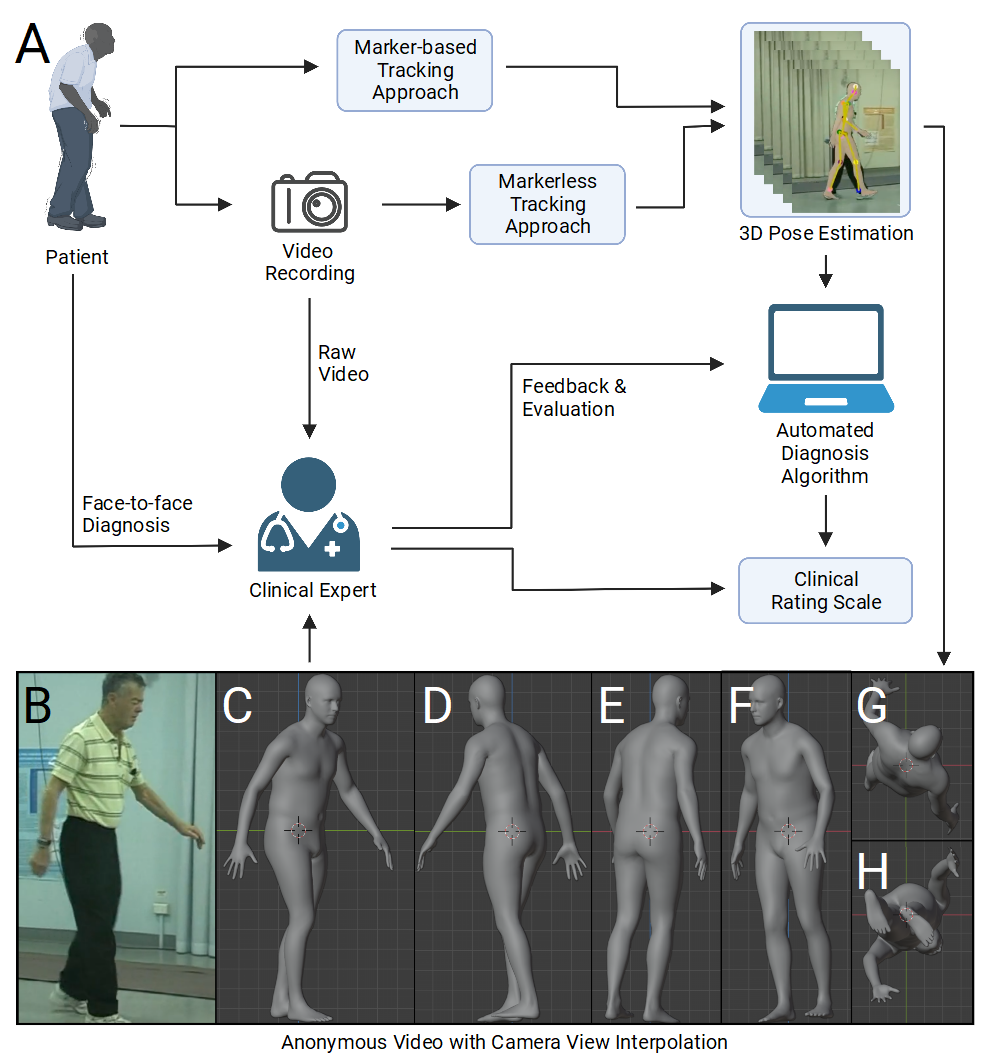
A number of opportunities are made available by advancements in computer vision that will enable digitization of human form, movements, and will represent them synthetically in 3D. Representing human movements within synthetic body models will potentially pave the way towards objective standardized digital movement disorder diagnosis and building sharable open-source datasets from such processed videos. Such digital movement capturing methods will be important for both machine learning-based diagnosis and computer vision-aided clinical assessment. It would also supplement face-to-face clinical visits and be used for longitudinal monitoring and remote diagnosis. Towards a Visualizable, De-identified Synthetic Biomarker of Human Movement Disorders. J Parkinsons Dis. 2022 Aug 27;1(-1):2085-2096. doi: 10.3233/JPD-223351.
A three-dimensional virtual mouse generates synthetic training data for behavioral analysis

We developed a three-dimensional (3D) synthetic animated mouse based on computed tomography scans that is actuated using animation and semirandom, joint-constrained movements to generate synthetic behavioral data with ground-truth label locations. Image-domain translation produced realistic synthetic videos used to train two-dimensional (2D) and 3D pose estimation models with accuracy similar to typical manual training datasets. The outputs from the 3D model-based pose estimation yielded better definition of behavioral clusters than 2D videos and may facilitate automated ethological classification. The model can be a time savings as annotation markers used for training pose-estimation tools such as DeepLabCut can be built into the model and transferred as coordinates without a need for hand labelling. See potential applications for autism research published in Spectrum News.
Synthetic training set for open field behaviors
Under development models water reaching and grooming.
Under development water reaching for stroke recovery assessment single trial response.
Mesoscale Mapping of Mouse Cortex Reveals Frequency-Dependent Cycling between Distinct Macroscale Functional Modules
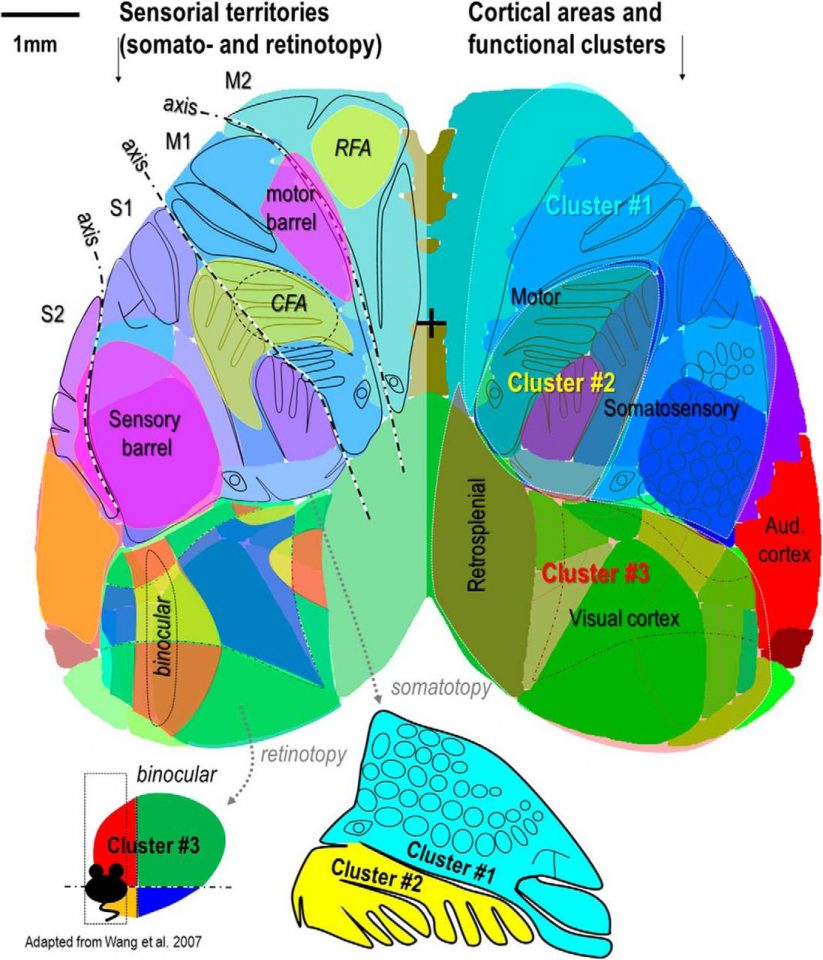
Connectivity mapping based on resting-state activity in mice has revealed functional motifs of correlated activity. However, the rules by which motifs organize into larger functional modules that lead to hemisphere wide spatial-temporal activity sequences is not clear. We used in vivo wide-field calcium imaging of the indicator GCaMP6 awake mice to characterize the organization of spontaneous cortical activity at different spatiotemporal scales. Correlation analysis defines the presence of two to three superclusters of activity that span traditionally defined functional territories and were frequency dependent. Vanni MP, Chan AW, Balbi M, Silasi G, Murphy TH. Mesoscale Mapping of Mouse Cortex Reveals Frequency-Dependent Cycling between Distinct Macroscale Functional Modules. J Neurosci. 2017;37(31):7513-7533. doi:10.1523/JNEUROSCI.3560-16.2017
Event triggered mesoscale GCaMP6 imaging: how wide-scale cortical spontaneous activity is linked to the firing of single neurons (potentially anywhere in brain)
Xiao D, Vanni MP, Mitelut CC, et al. Mapping cortical mesoscopic networks of single spiking cortical or sub-cortical neurons. Elife. 2017;6. doi:10.7554/eLife.199763560-16.2017
RFID mouse tracking open source Python software and Raspberry Pi interface
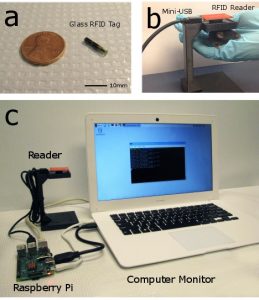
Automation of animal experimentation improves consistency, reduces potential for error while decreasing animal stress and increasing well-being. Radio frequency identification (RFID) tagging can identify individual mice in group housing environments enabling animal-specific tracking of physiological parameters. The Python software can serve as the basis of any behavioral or physiological task where users will need to identify and track specific animals. Bolaños F, LeDue JM, Murphy TH. Cost effective raspberry pi-based radio frequency identification tagging of mice suitable for automated in vivo imaging. J Neurosci Methods. 2017;276:79-83. doi:10.1016/J.JNEUMETH.2016.11.011
Automated mouse home cage imaging
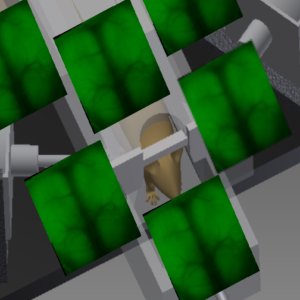
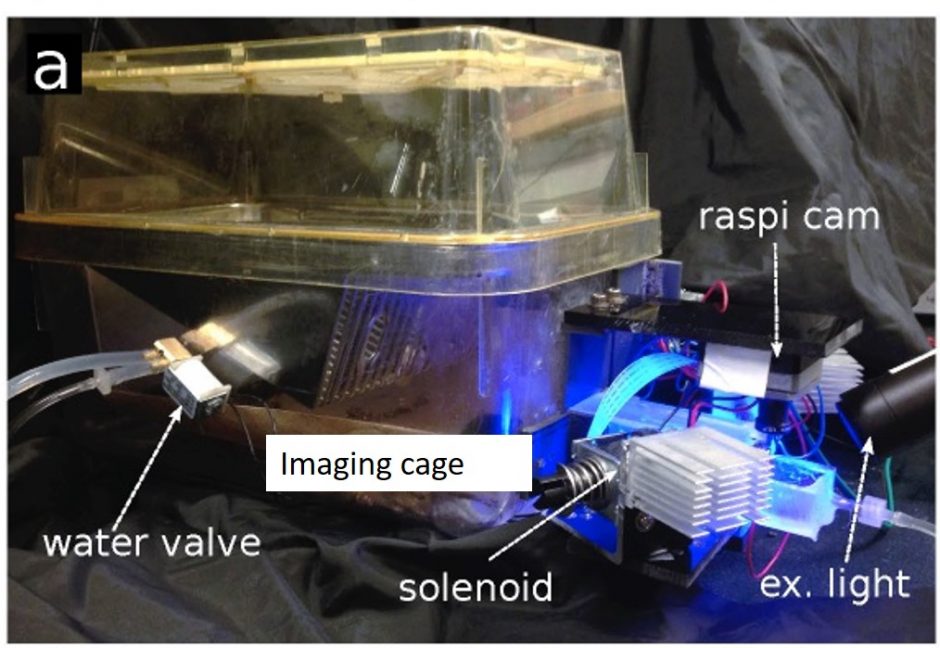
Mouse home cage cortical mesoscopic imaging supports 5 mice at a time and requires minimal investigator intervention. Murphy TH, Boyd JD, Bolaños F, et al. High-throughput automated home-cage mesoscopic functional imaging of mouse cortex. Nat Commun. 2016;7. doi:10.1038/ncomms11611
Collaborative project (led by AM Craig UBC) linking altered cortical dynamics to synaptic suppressor protein MDGA2
Connor SA, Ammendrup-Johnsen I, Chan AW, et al. Altered Cortical Dynamics and Cognitive Function upon Haploinsufficiency of the Autism-Linked Excitatory Synaptic Suppressor MDGA2. Neuron. 2016;91(5):1052-1068. doi:10.1016/j.neuron.2016.08.016cortex. 2016. doi:10.1038/ncomms11611JNEUMETH.2016.11.011
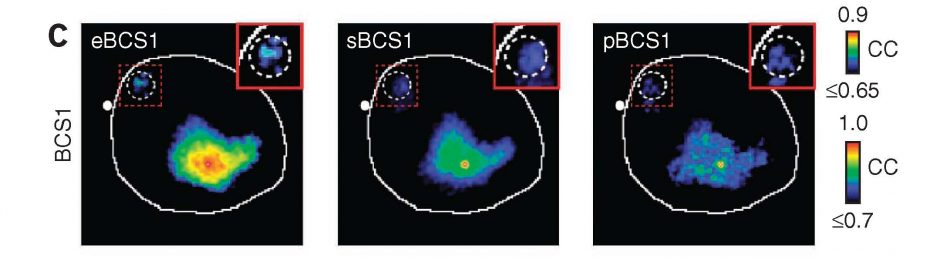
Optogenetic mapping after stroke reveals network-wide scaling of functional connections and heterogeneous recovery of the peri-infarct
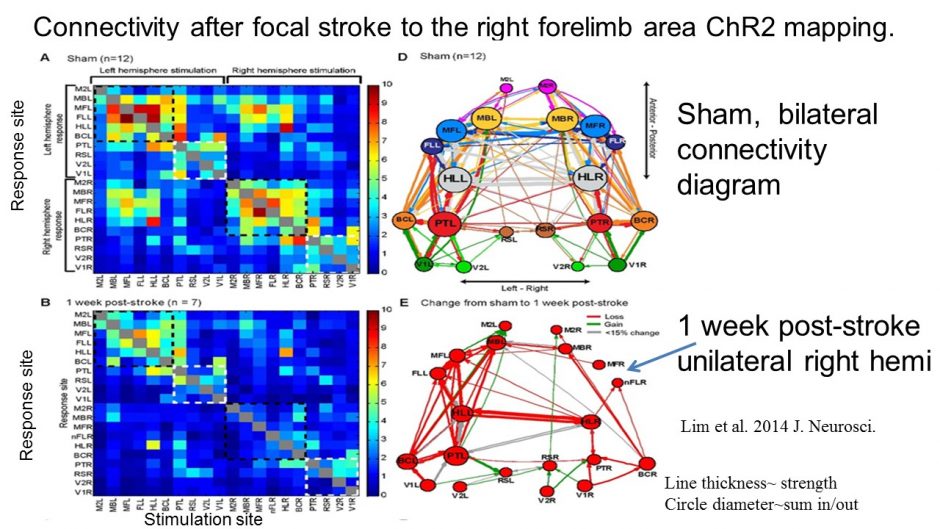
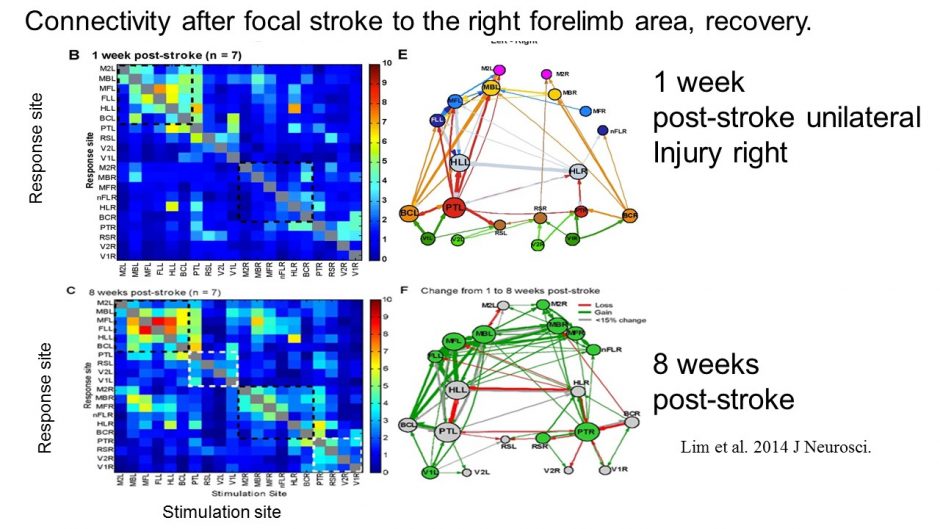
Stroke is restricted to the right side of the mouse brain (localized to the forelimb area), but deficits (red) in connection strength at 7 days and gains (green) from 1 week to 8 weeks recovery are felt throughout the network. Lim DH, LeDue JM, Mohajerani MH, Murphy TH. Optogenetic Mapping after Stroke Reveals Network-Wide Scaling of Functional Connections and Heterogeneous Recovery of the Peri-Infarct. J Neurosci. 2014;34(49):16455-16466. doi:10.1523/jneurosci.3384-14.2014
A mouse model of small-vessel disease that produces brain-wide-identified microocclusions and regionally selective neuronal injury
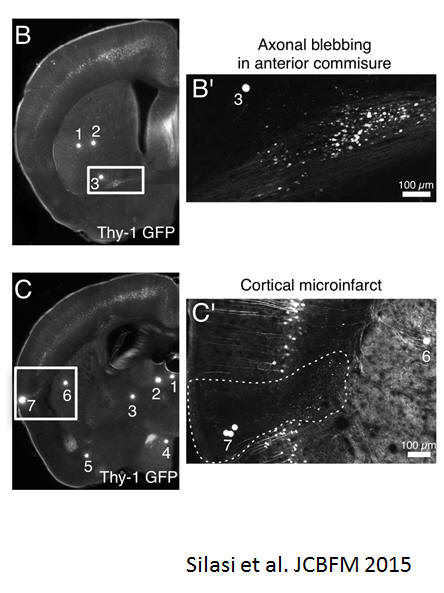
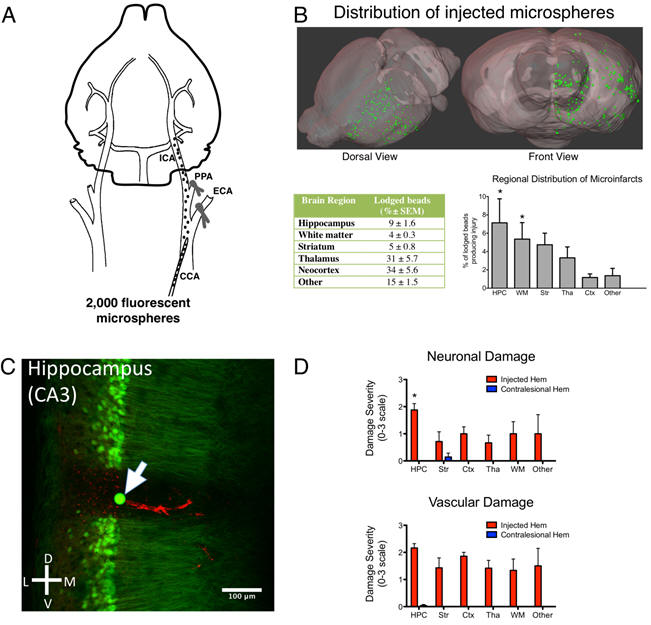
We developed a mouse model of small-vessel disease where occlusions are produced through endovascular injection of fluorescent microspheres that target ~12 μm diameter penetrating arterioles and can be localized in histology. Using Thy1-GFP transgenic mice, we visualized the impact of microocclusions on neuronal structure. Microocclusions in the hippocampus produce cell loss or neuronal atrophy (~7% of lodged microspheres led to microinfarcts), while axons within white matter tracts, as well as the striatum and thalamus became blebbed or disrupted. Silasi G, She J, Boyd JD, Xue S, Murphy TH. A mouse model of small-vessel disease that produces brain-wide-identified microocclusions and regionally selective neuronal injury. J Cereb Blood Flow Metab. 2015;35:734-738. doi:10.1038/jcbfm.2015.8
Cortical mapping article and interactive tool
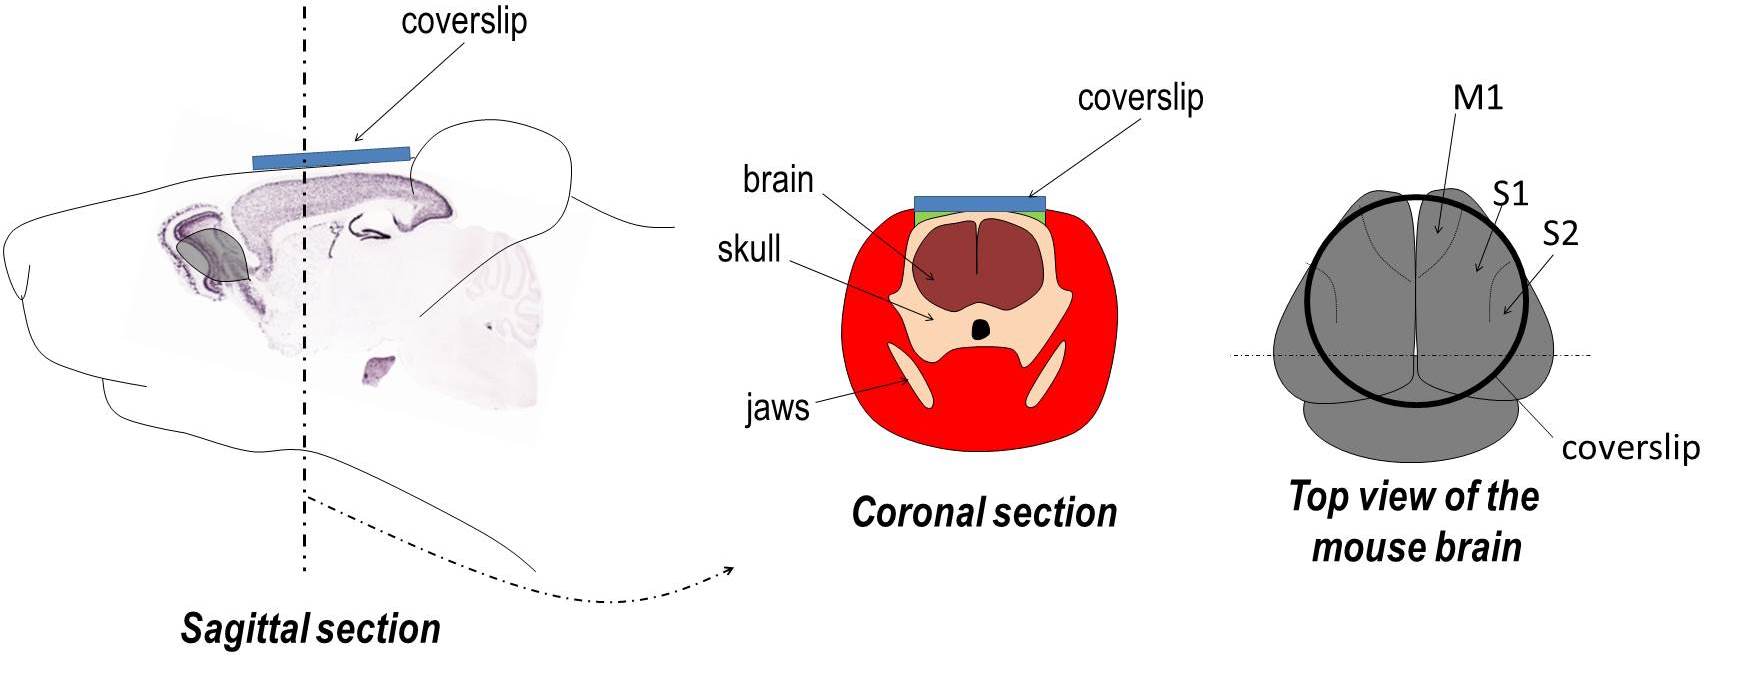
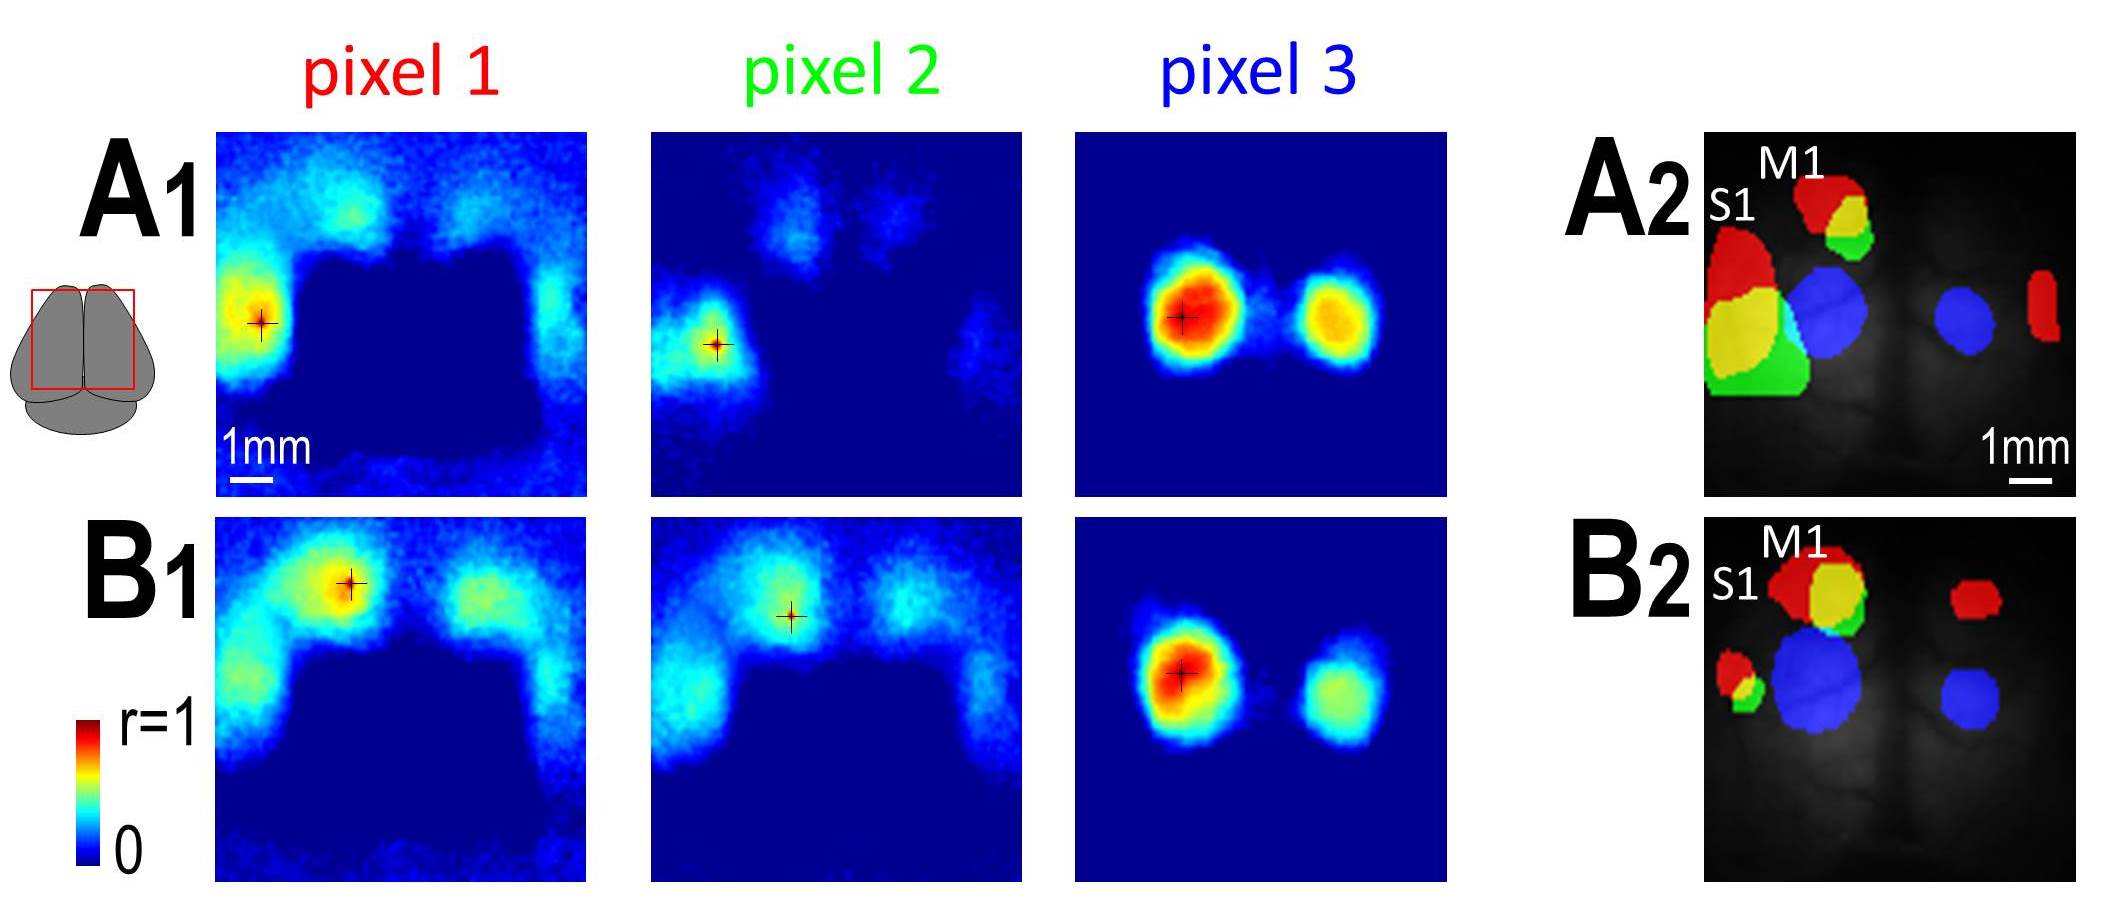
Imaging through intact bone using a chronic window reveals functional symmetries between M1 and S1. Maps are made using correlated spontaneous activity with a particular seed location. To assess your own seeds of interest, click here and a local correlation viewer will open (be patient – takes 30-60 sec). Move the mouse over the window to see different local maps within the 9×9 mm bilateral window (the viewer only works in Internet Explorer and Chrome; no Firefox). We thank Caroline Rougier for assistance with the HTML code. The interactive maps represent both hemispheres with a field of view similar to the right image above. Vanni MP, Murphy TH. Mesoscale Transcranial Spontaneous Activity Mapping in GCaMP3 Transgenic Mice Reveals Extensive Reciprocal Connections between Areas of Somatomotor Cortex. J Neurosci. 2014;34(48):15931-15946. doi:10.1523/jneurosci.1818-14.2014
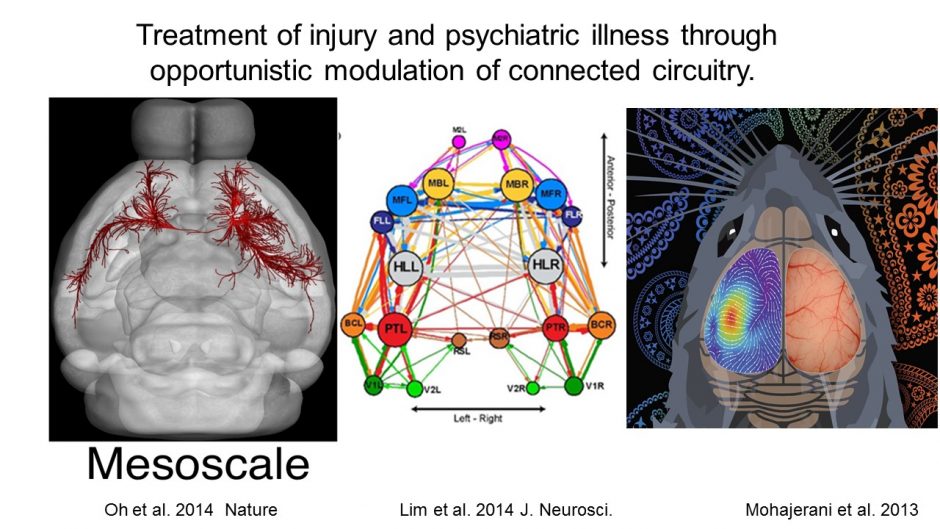
Mapping canonical long-range structural and functional mesoscopic circuits in the mouse brain
Mohajerani MH, Chan AW, Mohsenvand M, et al. Spontaneous cortical activity alternates between motifs defined by regional axonal projections. Nat Neurosci. 2013;16(10):1426-1435. doi:10.1038/nn.3499
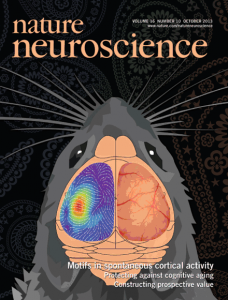
Spontaneous cortical activity alternates between motifs defined by regional axonal projections
We define consensus pathways for activity flow across wide regions of mouse cortex using voltage sensitive dye imaging in mouse cortex. Patterns of activity flow strongly resembled connectivity maps for intracortical monsynaptic projections derived from assessment of the connectivity database made by the Allen Institute for Brain Science. Activity sources and sinks can be observed in the video clip that shows the average response to C2 whisker stimulation below. If you are interested, the first author PDF Dr. Majid Mohajerani now has a new lab at the Univ. of Lethbridge AB.
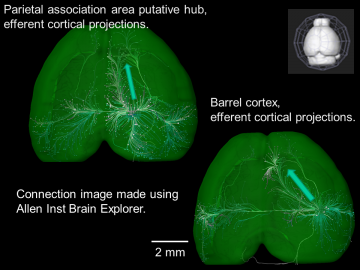
New tools for charting the mouse intracortical connectome from the Allen Institute for Brain Science
Projection from barrel cortex to motor cortex is shown (see arrow). Parietal association area makes strong midline projection (see arrow). For functional connectivity strengths in and out of these areas see Lim et al. 2012 and Mohajerani et al. 2013. We have used the raw data from the Allen Institute Conectivity Atlas to compare functional to structural connectivity.
 Three methods for functional mapping of mouse barrel cortex yield similar results (left whisker movement, middle spontaneous activity, right Channelrhodopsin-2 direct cortical stimulation)
Functional connectivity maps were compared to patterns of axonal projections from the Allen Institute database (not shown). A small island of labeling is present in motor cortex (inset).
Optical flow measurement of C2 whisker-evoked VSD response
Whisker stimulation-evoked VSD activation (average of 20 trials). Left, black arrows indicate the direction of velocity of VSD signal spread. Relative magnitude of velocity is indicated by arrows size. Right, for response in left, measurements of absolute velocity are represented in pseudocolor. Streamlines indicate local direction of velocity flow.
Optogenetic approaches for functional mouse brain mapping
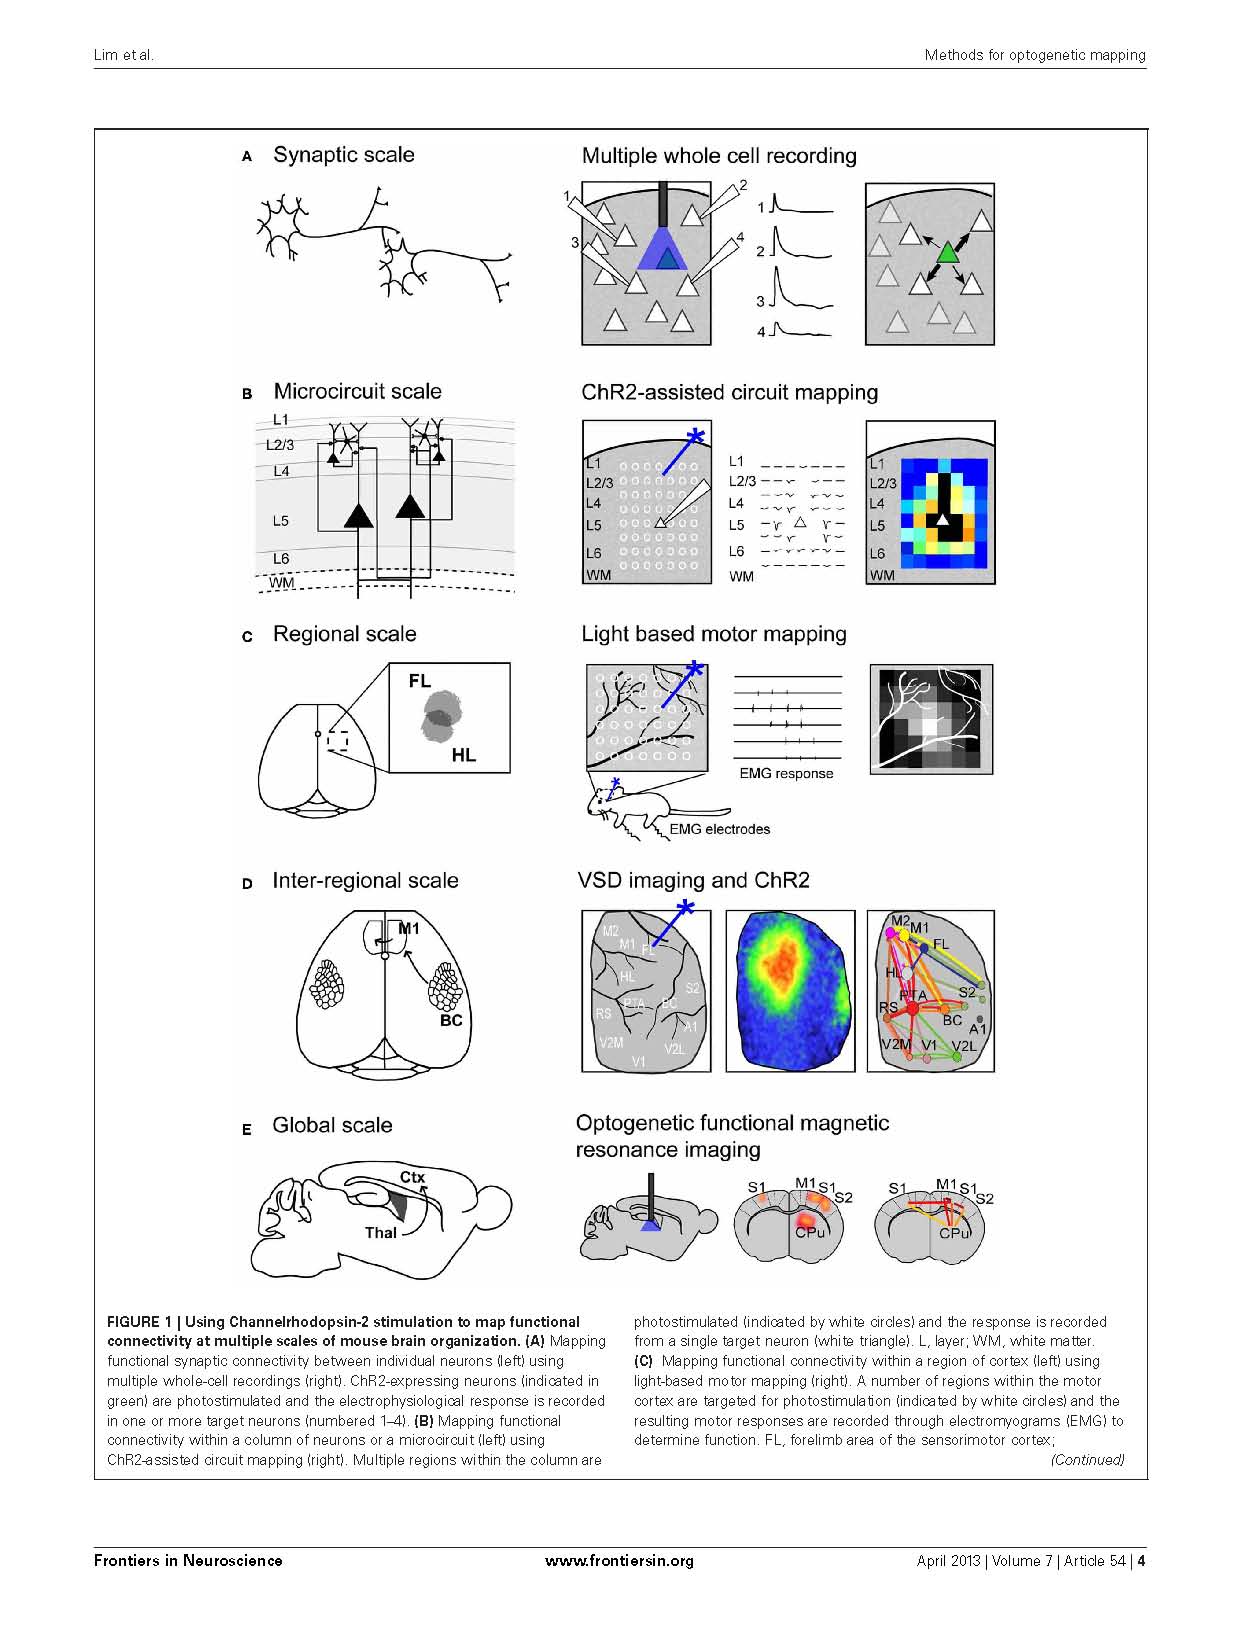
This paper describes recent approaches to mapping function within the mouse brain in vivo with optogenetics and highlights mesoscale imaging that our lab has developed. Lim DH, LeDue J, Mohajerani MH, Vanni MP, Murphy TH. Optogenetic approaches for functional mouse brain mapping. Front Neurosci. 2013;7:54. doi:10.3389/fnins.2013.00054
In vivo large-scale cortical mapping using channelrhodopsin-2 stimulation in transgenic mice reveals asymmetric and reciprocal relationships between cortical areas
A new approach to assess connections between cortical areas that will be applied to study plasticity after stroke. Note similarities between maps evoked by visual stimulation and channelrhodopsin stimulation of visual cortex in video clip. Lim DH, Mohajerani MH, LeDue J, Boyd J, Chen S, Murphy TH. In vivo Large-Scale Cortical Mapping Using Channelrhodopsin-2 Stimulation in Transgenic Mice Reveals Asymmetric and Reciprocal Relationships between Cortical Areas. Front Neural Circuits. 2012;6:11. doi:10.3389/fncir.2012.00011
Loss of synaptic structure during stroke occurs despite deep hypothermia
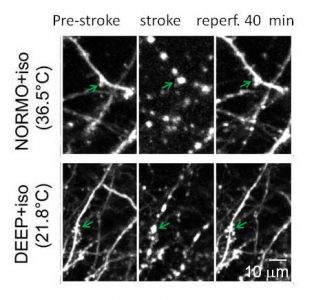
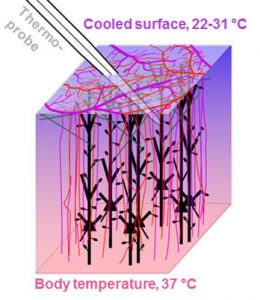
While post-ischemic hypothermia reduces neuronal injury following global ischemia, spared neurons may still show ultrastructural abnormalities in the days after the initial insult (Colbourne et al. 1999). We have evaluated hypothermia’s effects on dendrite morphology in the immediate phase of ischemia and in early reperfusion using repeated 2-photon in vivo imaging. Ischemia-induced dendritic blebbing could not be prevented even with deep hypothermic treatment and may be an obligate effect of energy failure and impaired ionic homeostasis. These findings have implications for clinical practice since deep hypothermia (Mack et al. 2007) is used in some cardiac surgery procedures. Tran S, Chen S, Liu RR, Xie Y, Murphy TH. Moderate or deep local hypothermia does not prevent the onset of ischemia-induced dendritic damage. J Cereb Blood Flow & Metab. 2011;32:437-442. doi:10.1038/jcbfm.2011.178
Distinct cortical circuit mechanisms for complex forelimb movement and motor map topography
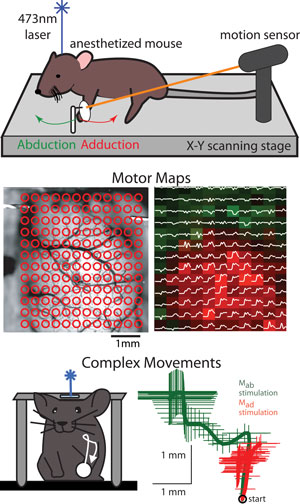
Upper image shows setup for movement measurement and mouse laser brain stimulation. Center left image shows cortical targets where Channelrhodopsin-2 stimulation was performed. Center right image show examples of general movement direction bias over the cortical surface, abduction versus adduction areas indicated. Lower image shows an example of a complex movement evoked by prolonged stimulation.
The motor cortex has long been known to play a central role in the generation of movement, but fundamental questions remain about the functional organization of its subregions and their neuronal circuits. Results from electrical brain stimulation have traditionally been interpreted with an emphasis on a cortical body map, but the utility of this principle has diminished with the discovery of multiple representations of the body that could overlap in cortical space. Despite the detailed knowledge gleaned from these efforts, our understanding of the macroscopic organization of motor cortex remains incomplete. Much of our understanding about the motor cortex comes from experiments in which stimulation or recording is performed at a few cortical points. Recently, we and others have developed a novel method for rapid automated multi-point motor mapping based on light activation of the recombinant ion channel Channelrhodopsin-2. We apply light-based motor mapping to investigate the functional subdivisions of the motor cortex and their dependence on intracortical synaptic activity.
The ability to repeatedly map the motor cortex over timescales ranging from minutes to months has allowed us to appreciate the dynamic nature of movement representations and facilitated the comparison of motor maps generated before and after pharmacological perturbations of the intracortical circuitry. We have exploited the predominant expression of Channelrhodopsin-2 in layer 5 pyramidal neurons of Thy-1 transgenic mice to target this class of cortical output cells directly, exposing their contribution to motor cortex topography and identifying a functional subdivision of the mouse forelimb representation based on general movement direction. Prolonged trains of light or electrical stimulation revealed that activation of these subregions drives movements to distinct positions in space. To identify mechanisms that could account for the different movement types evoked by stimulation of these cortical subregions, we performed pharmacological manipulations of the intracortical circuitry and targeted anatomical tracing experiments.
Blocking excitatory cortical synaptic transmission did not abolish basic motor map topography (directional bias of movement), but the site-specific expression of complex movements was lost. Our data suggest that the topography of movement maps arises from their hard-wired segregated output projections, whereas complex movements evoked by prolonged stimulation require intracortical synaptic transmission.
Harrison TC, Ayling OGS, Murphy TH. Distinct Cortical Circuit Mechanisms for Complex Forelimb Movement and Motor Map Topography. Neuron. 2012;74(2):397-409. doi:10.1016/J.NEURON.2012.02.028
Targeted mini-strokes produce changes in interhemispheric sensory signal processing that are indicative of disinhibition within minutes
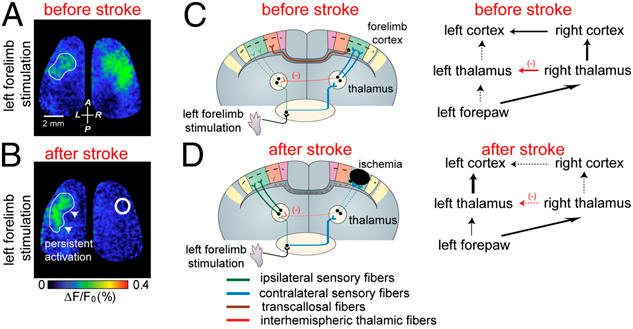
Pseudocolor images of voltage-sensitive dye signals in response to tactile stimulation of the left forepaw before (A) and after (B) targeted focal stroke within the right hemisphere (forelimb sensory cortical area). The stroke area is outlined by the white circle. (C and D) Cartoon illustrating the re-routing of sensory processing for the affected forelimb within the first hours of targeted ischemia.
Stroke-induced changes in circuit use can extend to both hemispheres within 1 hour, indicating that existing cortical circuits may be able to re-route sensory signals over long distances
The brain routes sensory signals to both hemispheres. Most processing is crossed or contralateral, but a minority of ipsilateral or un-crossed processing occurs. After stroke the ipsilateral non-crossed signal from the stroke-affected limb is preserved despite loss of the response in the contralateral cortex (the contralateral cortex is normally the source of the ipsilateral signal). Our results suggest that stroke leads to a switch in the mechanism of ipsilateral cortical processing and a relative enhancement of a normally latent (completely non-crossed) ipsilateral signal from the left forepaw to the left cortex (see right video). Disinhibiton was dependent on the contralateral thalamus. Other evidence for disinhibtion is from observations of enhanced responses to the non-stroke-affected paw (video below). While we do not yet know the behavioral significance of re-routing sensory information to preserve the affected-paw ipsilateral response after stroke (or to enhance responses to the non-affected paw), these results do suggest the potential for rapid engagement of latent long-range cortical circuits. Mohajerani MH, Aminoltejari K, Murphy TH. Targeted mini-strokes produce changes in interhemispheric sensory signal processing that are indicative of disinhibition within minutes. Proc Natl Acad Sci. 2011;108(22):E183-E191. doi:10.1073/pnas.1101914108
Movie of the left “affected” forelimb response before/after stroke (preservation of ipsilateral response to stroke-affected paw).
Stroke center is indicated by a circle, bregma (skull landmark) by a dot. The ipsilateral response (left side) is seen well before any residual response in the stroke affected hemisphere. A new mechanism of ipsilateral signal routing was observed after stroke with an apparent enhancement of non-crossed input from the stroke-affected paw leading to a preserved ipsilateral cortex response. In some cases the amplitude of this novel ipsilateral cortex response was even enhanced see ~100 ms after stimulation in video above.
Movie of the “right” non-affected forelimb response before/after stroke on right side – see circle (enhancement of contralateral response to non-stroke-affected right paw).
Both hemispheres are shown in voltage sensitive dye response movie. Signifcantly enhanced contralateral and ipsilateral responses were observed for the non-stroke affected paw.
Two-Photon Imaging during Prolonged Middle Cerebral Artery Occlusion in Mice Reveals Recovery of Dendritic Structure after Reperfusion
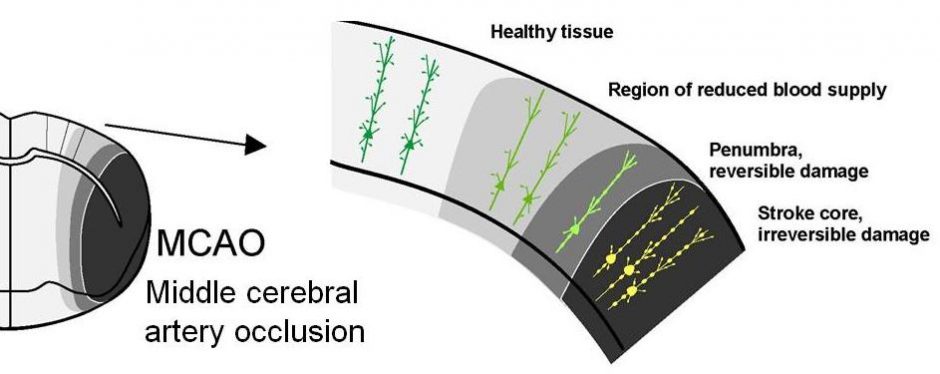
Stroke rapidly damages neuronal structural circuitry. If the blood supply is promptly restored (reperfusion) the structure within the stroke penumbra (area near the border with partial flow) can recover. However, the stroke core is less likely to recover even with reperfusion. The lost function of the core region may be compensated for by related brain areas through a process termed “plasticity”. Li P, Murphy TH. Two-Photon Imaging during Prolonged Middle Cerebral Artery Occlusion in Mice Reveals Recovery of Dendritic Structure after Reperfusion. J Neurosci. 2008;28(46):11970-11979. doi:10.1523/jneurosci.3724-08.2008
Stroke-induced plasticity made simple (hopefully)
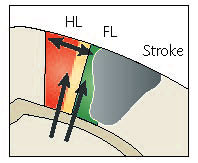
Major points are made below, see review for the details. FL and HL indicate forelimb and hindlimb somatosensory cortex respectively. When stroke affects the forelimb (FL) cortex activity can re-map to related areas such as hindlimb (HL) cortex or motor cortex. Murphy TH, Corbett D. Plasticity during stroke recovery: from synapse to behaviour. Nat Rev Neurosci. 2009;10. doi:10.1038/nrn2735
“Reader’s Digest” condensed version of the review.
1) Reductions in blood flow to the brain of sufficient duration and extent lead to stroke, which results in damage to neuronal networks and impairment of sensation, movement, or cognition. We find that apparent damage to networks can occur after only 2-3 min of ischemia where blood flow drops to less than 20% of basal values.
2) A time-limited window of neuroplasticity opens over weeks following stroke in the adult brain, during which partial behavioral recovery can occur, that can be further augmented by rehabilitative therapy.
3) Enhanced sensory and motor performance that occur after stroke is referred to as ‘recovery’, although re-emergent post-stroke behaviour is unlikely to be identical to the pre-stroke state, therefore a more accurate term is behavioural compensation provided by remaining and newly developed brain circuits that result in altered and/or new response strategies.
4) Plasticity in the adult brain after stroke is enabled by a surprising amount of diffuse and redundant synaptic connectivity within the CNS, and the ability of new structural and functional circuits to form through re-mapping between related cortical regions.
5) Many of the molecular mechanisms underlying stroke recovery are similar to those involved during development, a “critical period” of heightened neuroplasticity akin to that occurring during visual system development may exist after stroke. For successful rehabilitation after stroke it is critical to align behavioral interventions with critical periods.
6) It is possible to conceptualize synaptic learning rules after stroke into two broad classes and temporal phases: occurring first are mechanisms that ensure that each neuron receives an adequate amount of synaptic input akin to homeostatic plasticity, occurring later are Hebbian mechanisms in which synaptic strength is redistributed to favor coincident activity and properly functioning circuits. Although these are concepts and mechanisms that have been described in other systems whether they occur in the stroke affected brain is currently unclear.
How can basic knowledge aid stroke victims? It may be possible to develop drugs that stimulate neurotransmitter action or circuit sprouting. However, the most practical means (and immediately applicable) of facilitating stroke recovery may be innovative rehabilitation strategies or even brain stimulation protocols that promote the proper use of remaining circuits using insight gathered from basic research. It is even possible that the vehicle for accomplishing rehabilitation may be already in the grandkids’ bedroom in the form of movement-based gaming systems (Wii) that can be easily adapted to stroke recovery as recently done by some clinical institutions including the University of Toronto. Other means of brain stimulation include transcranial magnetic stimulation (TMS) that is currently used on stroke patients that our colleagues at UBC use in research. One of our goals is to employ brain stimulation in animal models using light and channelrhodopsin-2 to establish the timing and other parameters that will be important for effective treatment of the patient with methods such as TMS.
We use two-photon imaging to assess how individual neurons and their dendritic arbors are affected by stroke within the mouse brain
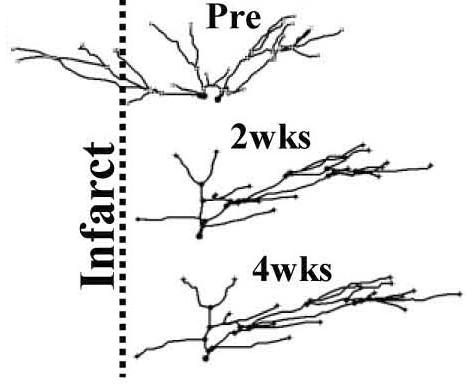
Apical dendritic arbor of a single somatosensory neuron shown at 3 different timepoints (Brown et al. 2010).
Events that occur just after stroke induction and the weeks that following including dendritic blebbing, cell death, spine production, changes in vasculature (angiogenesis) and selective maintenance of dendrites that project away from the infarct and loss those in the most ischemic areas.
Selective re-modeling of peri-infarct dendrites observed by longitudinal 2-photon imaging in mice weeks after stroke. Brown CE, Boyd JD, Murphy TH. Longitudinal in vivo imaging reveals balanced and branch-specific remodeling of mature cortical pyramidal dendritic arbors after stroke. J Cereb Blood Flow & Metab. 2009;30:783-791. doi:10.1038/jcbfm.2009.241nrn2735
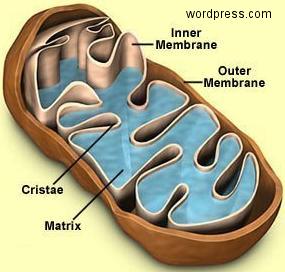
We determine using two-photon imaging how the mitochondrion (energy generating capacity of the cell) is affected during the first minutes after a stroke
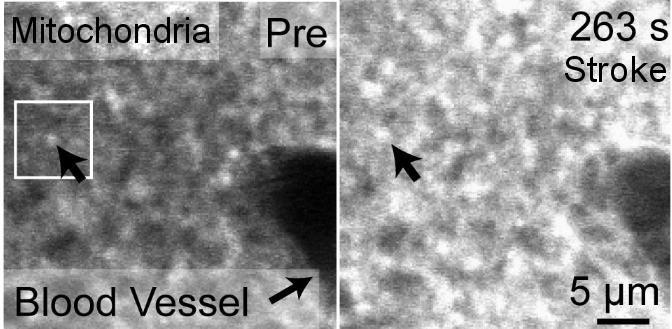
Nov. 2009: Surprisingly, in vivo imaging of mitochondria depolarization suggests mediators of delayed cell death may be activated within 5 min of stroke onset.
Left panel of center image and above left cartoon movie show changes in dendrite structure and possible initiation of cell death mechanisms after stroke. Although neurons can partially recover from structural damage when blood flow is restored (reperfusion), they may still be subject to delayed cell death via a process called apoptosis. The mitochondria (left) normally supplies the cell with energy, but its depolarization through the mitochondrial permeability transition pore can trigger apoptosis and delayed cell death. Here we image mitochondria in living mice during stroke (above images) using a dye called Rh-123 and 2-photon microscopy. We show that mitochondrial depolarization that has hallmarks of this mechanism occurs within 5 min of stroke induction (brighter image on right). These results suggest that treating both loss of structure and initiation of cell death mechanisms are important for maintaining function. Fortunately for stroke victums not all neurons die from apoptosis and neurons with partially intact synaptic structure continue to function. Rehabilitation and synaptic plasticity ensure that remaining circuits make up for some of the losses due to stroke. Liu RR, Murphy TH. Reversible cyclosporin A-sensitive mitochondrial depolarization occurs within minutes of stroke onset in mouse somatosensory cortex in Vivo: A two-photon imaging study. J Biol Chem. 2009;284(52):36109-36117. doi:10.1074/jbc.M109.055301
Using regional imaging techniques and analysis of synaptic structure within living mice, we show that new structural and functional cortical circuits form within functionally related cortical areas areas that are close to the stroke core
; 11 Feb 2009.")
Cover of J.Neurosci. 29 (6); 11 Feb 2009. Two-photon image of a GFP-labeled layer 5 dendrite superimposed onto a montage showing whole-brain cortical responses to forelimb stimulation after stroke.
Feb. 2009: Stroke effects on brain circuit structure-function assessed with millisecond level brain functional imaging. Brown CE, Aminoltejari K, Erb H, Winship IR, Murphy TH. In Vivo Voltage-Sensitive Dye Imaging in Adult Mice Reveals That Somatosensory Maps Lost to Stroke Are Replaced over Weeks by New Structural and Functional Circuits with Prolonged Modes of Activation within Both the Peri-Infarct Zone and Distant Sites. J Neurosci. 2009;29(6):1719-1734. doi:10.1523/JNEUROSCI.4249-08.2009
Regional imaging techniques show that existing redundant cortical circuits may begin to compensate for the effects of stroke even sooner than previously anticipated (within hours)
Results of Voltage Sesitive Dye (VSD) imaging revealed that patterns of sensory-evoked depolarization redistribute within hours after an ischemic stroke in the forelimb region of the somatosensory cortex in mice.
Illustration of rapid sensory response redistribution mechanisms for somatosensory cortex function after stroke. Forelimb derived sensory signals are routed to the forelimb somatosensory cortex (FL), but also to a lesser extent to nearby cortical regions such as the sensory hindlimb (HL) representation. Within hours after stroke to the FL area, diffuse off-target FL derived signals that are present in HL cortex are spared from stroke damage and are well positioned to aid in re-mapping of circuits in the recovering animal. Sigler A, Mohajerani MH, Murphy TH. Imaging Rapid Redistribution of Sensory-Evoked Depolarization through Existing Cortical Pathways after Targeted Stroke in Mice. Vol 106.; 2009. doi:10.1073/pnas.0812695106
We also study the basic properties of cortical circuits with the hope of applying this knowledge to understand how brain circuits recover after stroke
Wild Type Mouse Acallosal Mouse
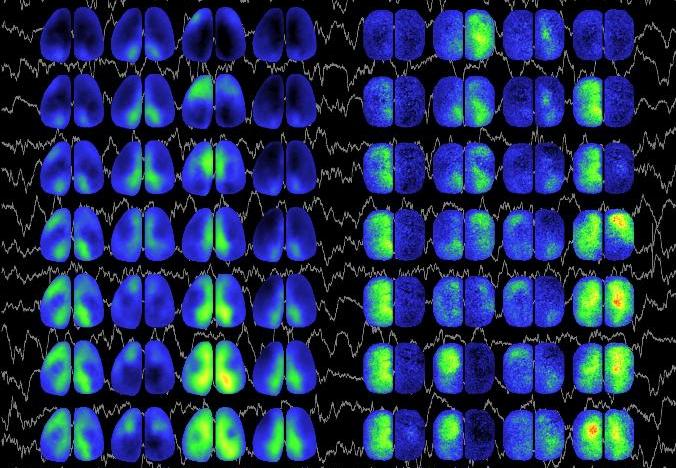
Regional patterns in spontaneous activity. Bilateral imaging of spontaneous fluctuations in cortical membrane potential measured with 20 milliseconds between images in wildtype (left columns) and acallosal (right) mice superimposed on traces of cortical EEG activity. Wildtype mice show bilaterally synchronous activity while acallosal mice oscillate asynchronously. Sequences of spontaneous activity are shown in 7 image columns corresponding to 140 ms of data. Clear patterns emerge in the WT mice that favor midline areas and may represent cortical default networks. Knowledge of these circuits may be important for understanding basic brain function and for recovery after disease such as stroke.
Mohajerani MH, McVea DA, Fingas M, Murphy TH. Mirrored Bilateral Slow-Wave Cortical Activity within Local Circuits Revealed by Fast Bihemispheric Voltage-Sensitive Dye Imaging in Anesthetized and Awake Mice. J Neurosci. 2010;30(10):3745-3751. doi:10.1523/jneurosci.6437-09.2010
Novel automated tools to study the motor system that will be applied to stroke
- Laser activation of Channelrhodospin-2, fixed brain shown.
- Maps of mouse forelimb motor cortex derived from light-evoked muscle activity. Left, raw EMG thumbnails. Right, grayscale map of EMG amplitude.
Feb. 2009: In vivo synaptic physiology and optogenetic brain mapping. Ayling OGS, Harrison TC, Boyd JD, Goroshkov A, Murphy TH. Automated light-based mapping of motor cortex by photoactivation of channelrhodopsin-2 transgenic mice. Nat Methods. 2009;6(3):219-224. doi:10.1038/nmeth.1303
Stroke brain circuit structure-function research questions/plan

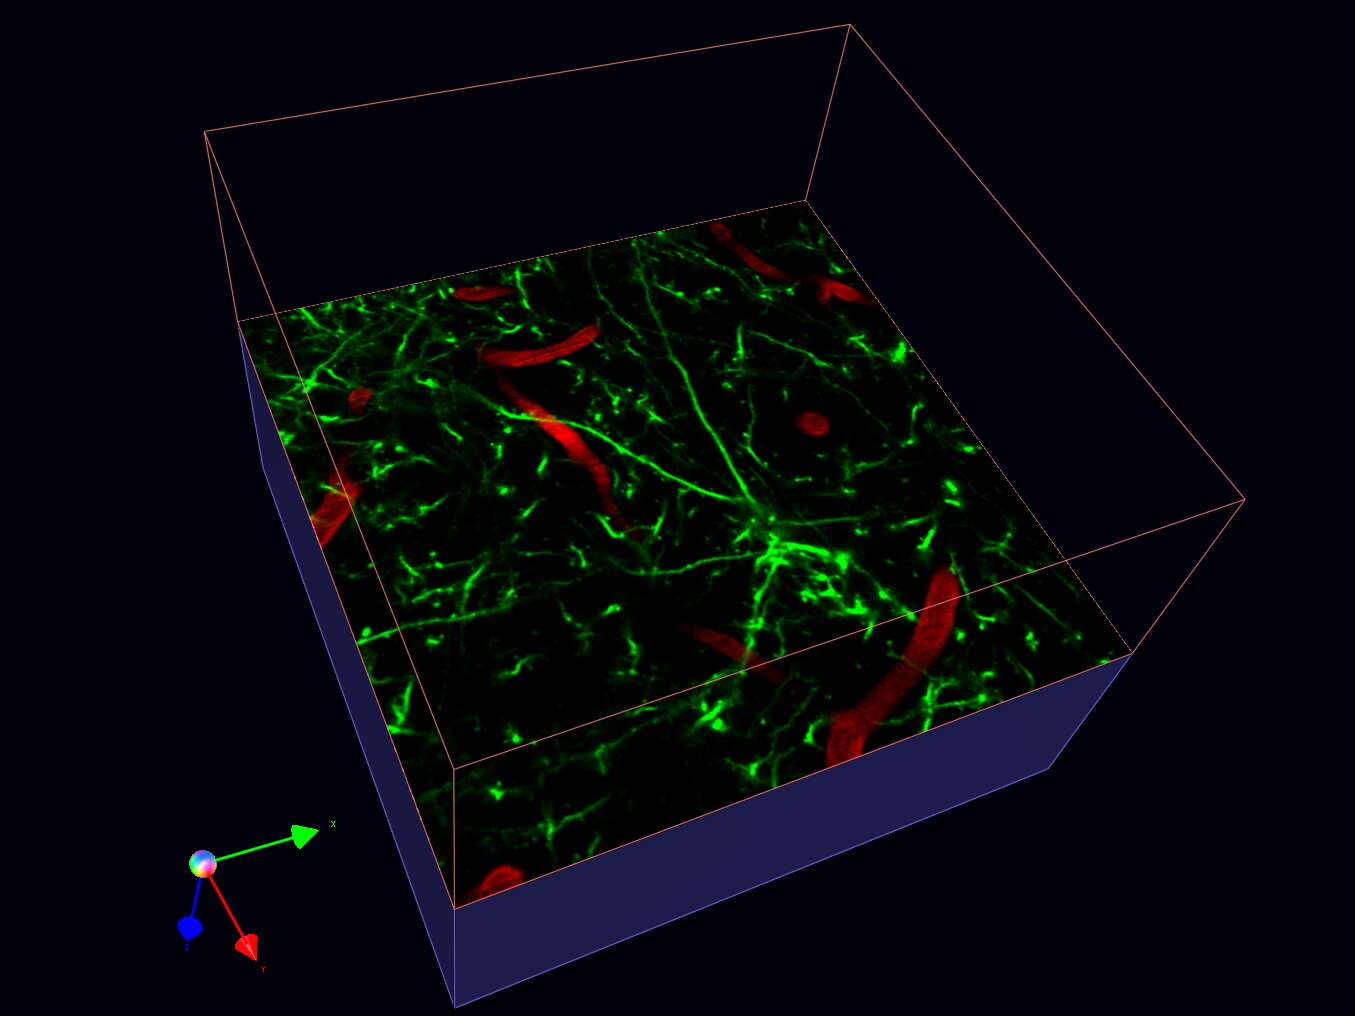
Image showing Texas-Red labeled vasculature and green dendrites taken from a green fluorescent protein transgenic mouse before induction of ischemia in vivo.

Close-up view of dendritic spine synapse vessel relationship in mouse brain in vivo. On average synapses are 13 micrometers from a flowing capillary and are supplied by about 100 red blood cells per second.
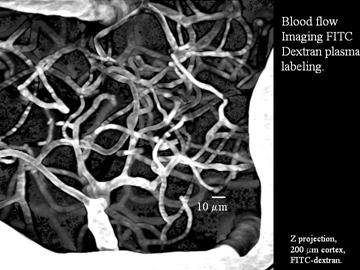
Cerebral vessels labeled in vivo using FITC-dextran permits monitoring blood flow at the single capillary level using 2-photon microscopy.
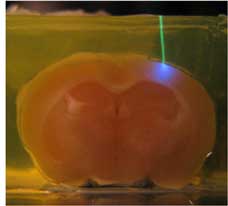
Sectioning through live brain with 2-photon microscopy, dendrites receiving end of synaptic inputs are labeled green (YFP line H transgenic) and blood vessels red (slice in a box view).
Our aim is to help stroke victims regain brain function through understanding of how synaptic networks are damaged and recover from interruptions in brain blood flow. We anticipate that advances learned in our lab will translate into new treatments, treatment guidelines, and hope.
There are two major goals for our research:
1) Reveal the key chemical and electrical events that lead to early stroke-induced damage to synaptic networks in intact animals by employing high-resolution two-photon and other forms of in vivo imaging. The hope is that if we can better understand these processes we might be able to stop them.
2) Understand the structural and functional basis of adaptive changes to brain circuitry that accompany stroke recovery. A key component of stroke recovery is the re-mapping of function from damaged brain areas to surviving areas. Although new areas of activation occur, how information flows in and out reorganized cortical networks on the millisecond timescale and by what circuitry is unclear. Our goal is to understand these changes with the aim of using this knowledge to promote the recovery of human stroke patients.
Tools for mapping brain circuit function

Intrinsic optical signal imaging/mapping provides a means of assessing cortical circuits involved in processing touch and permits linking microscopic structure of vessels and synapses to function.
Zhang S, Murphy TH. Imaging the impact of cortical microcirculation on synaptic structure and sensory-evoked hemodynamic responses in vivo. PLoS Biol. 2007;5(5):1152-1167. doi:10.1371/journal.pbio.0050119
Brain mapping of forelimb somatosensory cortex using intrinsic signal imaging (IOS)
Darkened area indicates the response to contralateral forelimb stimulation.
Harrison TC, Sigler A, Murphy TH. Simple and cost-effective hardware and software for functional brain mapping using intrinsic optical signal imaging. J Neurosci Methods. 2009;182(2):211-218. doi:10.1016/j.jneumeth.2009.06.021
Tools for creating targeted ischemia (stroke)
Laser induced small artery clotting by photoactivation of Rose Bengal
This process occurs over 2 min PLoS Biol (2007) 5:e119. It permits targeted stroke in mouse somatosensory cortex. The diameter of the shown arteriole is ~40 µm. See also Sigler A, Goroshkov A, Murphy TH. Hardware and methodology for targeting single brain arterioles for photothrombotic stroke on an upright microscope. J Neurosci Methods. 2008;170:35-44. doi:10.1016/j.jneumeth.2007.12.015
Stroke damage to synapses is apparent within minutes, but can be reversed with prompt reperfusion of blood
Rapid and reversible dendritic damage
Reversible damage to dendrites during ischemia and reperfusion (images shown are from layer I cortex).
Imaging waves of stroke damage
Changes in reflected light signal (ratio to preischemic condition, scaled between 95-105% of baseline reflectance) associated with ischemic depolarization over a 5 min period within a 3.1 mm wide brain window. The star on the upper right marks the time when ischemic depolarization was observed by monitoring the EEG . The time per frame is 1s and the movie starts 28s before the induction of ischemia as defined by EEG suppression. At the beginning of the movie the image is a uniform gray that corresponds to 100% of preischemic reflected light levels. Within 30s the surface vessels darken followed by the surrounding tissues indicating deoxygenation. ~170s after occlusion a wave of brightening (increased light scattering) begins to move across the cortex starting with the most anterior and lateral tissues. This wave leads to damaged synaptic networks.
Murphy TH, Li P, Betts K, Liu R. Two-Photon Imaging of Stroke Onset In Vivo Reveals That NMDA-Receptor Independent Ischemic Depolarization Is the Major Cause of Rapid Reversible Damage to Dendrites and Spines. J Neurosci. 2008;28(7):1756-1772. doi:10.1523/jneurosci.5128-07.2008
Changes to the structure and function of somatosensory circuits support stroke recovery weeks after ischemia
- Synapse addition in vivo.
- Synapse elimination in vivo (time in hours).
Brown CE, Li P, Boyd JD, Delaney KR, Murphy TH. Extensive Turnover of Dendritic Spines and Vascular Remodeling in Cortical Tissues Recovering from Stroke. J Neurosci. 2007;27(15):4101-4109. doi:10.1523/jneurosci.4295-06.2007
Changes to the function of single neurons that support re-mapping of sensory function weeks after ischemia
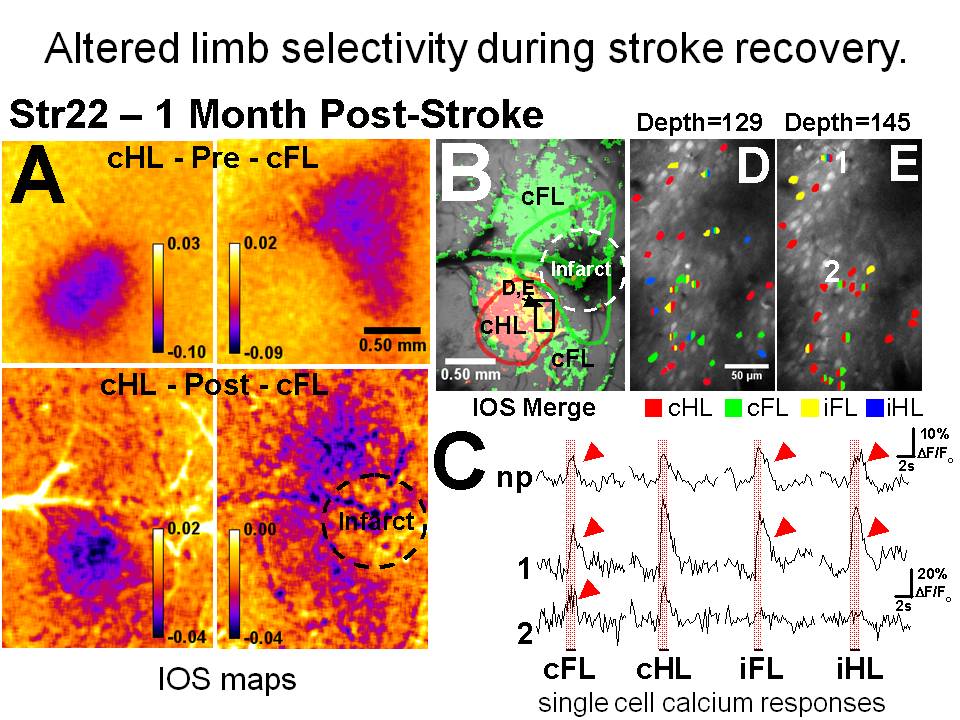
Layer 2 neurons that are normally responsive to only a single limb exhibit broader receptive fields and can respond to all 4 limbs as sensory responses are re-mapped.
Winship IR, Murphy TH. In Vivo Calcium Imaging Reveals Functional Rewiring of Single Somatosensory Neurons after Stroke. J Neurosci. 2008;28(26):6592-6606. doi:10.1523/jneurosci.0622-08.2008
Circuit and cellular level re-mapping model after stroke based on un-masking of sub-threshold connections between related regions of cortex
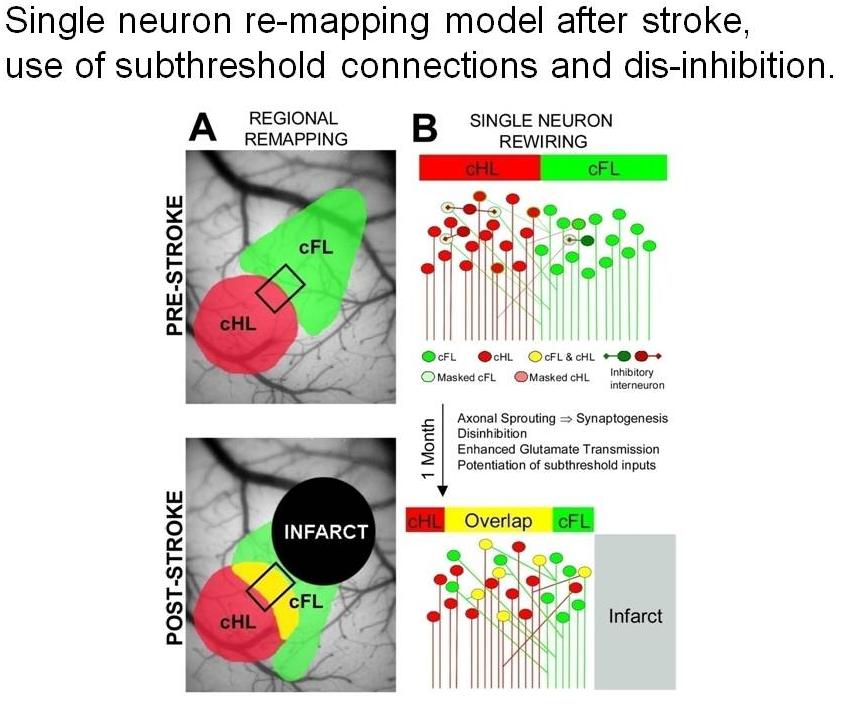
Winship IR, Murphy TH. Remapping the somatosensory cortex after stroke: Insight from imaging the synapse to network. Neuroscientist. 2009;15(5):507-524. doi:10.1177/1073858409333076
Imaging miniature synaptic activity at single synapses using calcium imaging
The video clip shows miniature synaptic calcium transients visualized with the fluorescent calcium probe (fluo-3) in a spiny cultured rat cortical neuron dendrite. The image shows activity over a 10 sec period.
Mackenzie PJ, Kenner GS, Prange O, Shayan H, Umemiya M, Murphy TH. Ultrastructural Correlates of Quantal Synaptic Function at Single CNS Synapses. Vol 19.; 2018. doi:10.1523/jneurosci.19-12-j0003.1999
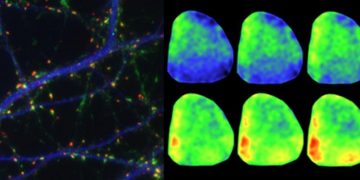
3D reconstructions of cortical synapses in culture
Shown are 3-D reconstructions of a rat cortical neuron spine from electron microscopic images. Analysis of spine function using calcium imaging suggests that larger more complex spines (having larger and multiple PSDs; indicated in dark color) have a greater quantal amplitude suggesting that structural changes to dendrites may be required for synaptic plasticity.